vue使用Echarts
背景
在做后台系统以及关于数据分析处理的项目中,图表的功能就必不可少,而目前市场上Echarts的使用占比还是比较高的,如何灵活低成本使用就尤为重要。
设计
通过把图表的数据、业务、组件解耦,这样可以达到高复用、易于维护。
编写组件
- 图表容器
可以从外部接收容器宽高。
<template>
  <div
    ref="chart"
    class="chart"
    :style="`--height:${height}px;--width:${width ? width + 'px' : '100%'}`"
  />
</template> props: {
height: {
type: Number,
default: 300
},
width: {
type: Number,
default: null
}
}<style lang="scss" scoped>
.chart {
width: var(--width);
height: var(--height);
}
</style>- 基础功能
<script>
//引入包
import * as echarts from 'echarts'
export default {
name: 'ChartModel',
  props: {
    height: {
      type: Number,
      default: 300
    },
    width: {
      type: Number,
      default: null
    }
},
data() {
return {
chart: {}
}
},
mounted() {
this.initChart()
},
beforeDestroy() {
this.chart.clear()
this.chart.dispose()
this.chart = {}
},
methods: {
//初始化图表
initChart() {
this.chart = echarts.init(this.$refs.chart)
this.chart.resize()
},
//更新图表
setOptions(options) {
this.chart.clear()
this.chart.hideLoading()
this.chart.setOption(options)
},
//空图表
emptyOptions() {
this.chart.clear()
this.chart.hideLoading()
this.chart.setOption({
title: {
text: '暂无数据',
x: 'center',
y: 'center',
textStyle: {
color: '#0058D8',
fontWeight: 'normal',
fontSize: 16
}
}
})
},
//图表加载动画
showLoading() {
this.chart.showLoading('default', {
text: '加载中...',
color: '#0058D8',
textColor: '#0058D8',
maskColor: 'rgba(255, 255, 255, 0)'
})
}
}
}
</script>从methods中可以看到提供三个方法:setOptions(设置图表)、emptyOptions(设置空图表)、showLoading(开启加载动画)。
这里把图表数据提取出来,可以通过获取图表组件实例去进行图表渲染。
- 响应式图表
相应式图表就比较容易了,通过监听resize事件使用Echarts中的resize方法即可,但需要注意的是项目中有侧边栏折叠的需要额外处理。我这里写成mixins,可以根据自己写
//resize事件简易代码
this.$_resizeHandler = debounce(() => {
	this.chart.resize()
}, 100)
window.addEventListener('resize', this.$_resizeHandler)
//侧边栏简易代码
$_sidebarResizeHandler(e) {
if (e.propertyName === 'width') {
this.$_resizeHandler()
}
},
//获取侧边栏
this.$_sidebarElm = document.getElementsByClassName('sidebar-container')[0]
//侧边栏是有动画的,所以可以监听transitionend事件
this.$_sidebarElm && this.$_sidebarElm.addEventListener('transitionend', this.$_sidebarResizeHandler)- 解决图表宽度100问题
图表宽度100问题一般出现在组件切换的时候,display从none变为block的时候获取不到宽度。
从网上搜解决方法的话一般就是使用v-if、设置图表的宽度等,但我想使用一种更加灵活智能的方法去实现。既然知道是由于display变化获取不到宽度,也知道可以通过Echarts的resize重新渲染,那么我只需要在切换的时候调一下resize方法不就好了吗,但是感觉使用成本挺高的,项目中使用图表很多,切换也很多,那我每次都需要写这么一句代码,这就跟 "灵活、智能" 没太大关系了,后来考虑到可以使用MutationObserver来实现。
//这个ob全局都要用,没必要放在data中
var ob = null
//加入一个props
props:{
	...
	// 祖先终止元素
    watchDom: {
      type: String,
      default: ''
    }
},
mounted() {
    this.initChart()
    // 解决宽度100问题,监听图表元素的祖先元素的display变化,变化则执行resize方法
    ob = new MutationObserver((mutationsList) => {
      for (const mutation of mutationsList) {
        if (mutation.type === 'attributes' && mutation.attributeName === 'style') {
          const isVisible = window.getComputedStyle(mutation.target).display !== 'none'
          if (isVisible) this.chart.resize()
        }
      }
    })
    const domList = this.findAncestor(this.$el)
    for (let i = 0; i < domList.length; i++) {
      ob.observe(domList[i], { attributes: true })
    }
},
  beforeDestroy() {
    this.chart.clear()
    this.chart.dispose()
    this.chart = {}
    //停止观察
    ob.disconnect()
  },
// 找到当前元素到祖先终止元素的所有元素
findAncestor(element) {
const endDom = this.watchDom ? document.querySelector(this.watchDom) : this.$parent.$el
var ancestors = [] // 存放祖先元素的数组
while (element.parentNode !== null) {
ancestors.push(element)
if (element === endDom) break // 找到指定终止元素后跳出循环
element = element.parentNode
}
return ancestors
}分析: 既然是由于父级元素display变化引起的,那我监听当前图表的父级元素即可,如果没有传入终止条件的话,就只会找到父级,传入终止条件的话就会多监听一些元素。这样这些父级元素的display变化就会重新渲染就可以解决宽度100的问题了。从性能上考虑还可以,正常情况下一个页面可能也就监听几个dom元素吧,只要一个页面中的图表不是太多,图表层级不深都没什么影响。
这里使用这种方法只事给大家提供一个思路,大家有其它的想法可以讨论一下。
使用组件
- 准备数据
//可以根据页面准备一个配置js-chartOptions.js
export const test = {
	xAxis: {
    	type: 'category',
    	data: []
  	},
  	yAxis: {
    	type: 'value'
  	},
  	series: [
    	{
      		data: [],
      		type: 'line'
    	}
  	]
}- 业务使用
<ChartModel ref="chartRef" :height="360" />import ChartModel from '@/components/ChartModel'
//引入图表配置
import { test } from './chartOptions'
//图表渲染
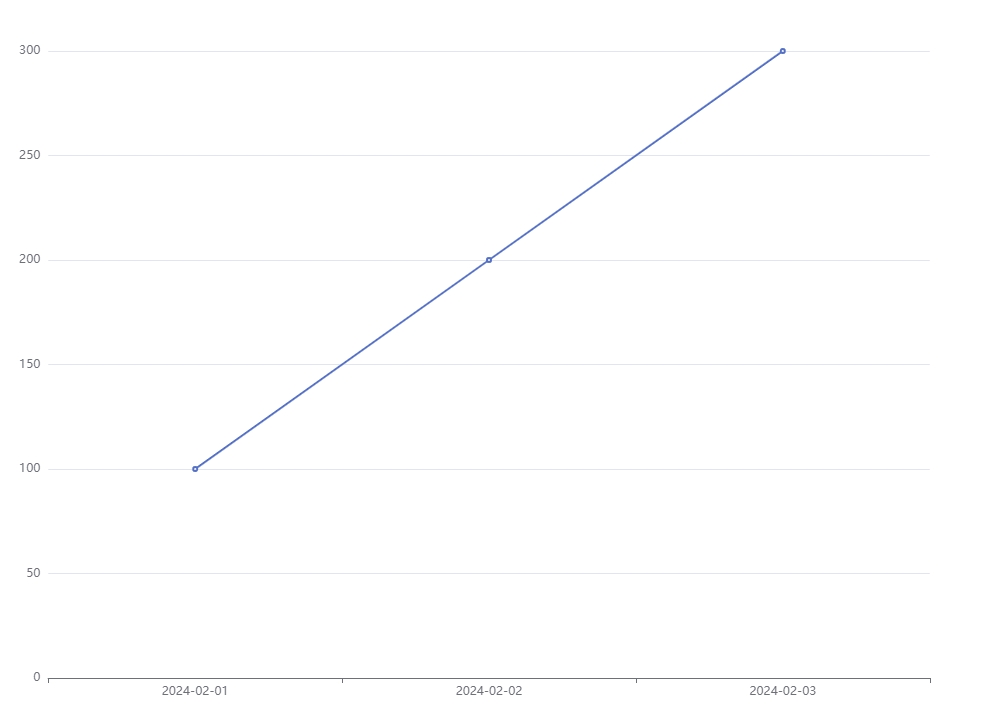
filterChart(){
//模拟数据,根据实际接口数据为准
let list = [
{
date:'2024-02-01',
value:100
},
{
date:'2024-02-02',
value:200
},
{
date:'2024-02-03',
value:300
}
]
//获取实例
const chartInstance = this.$refs.chartRef
//数据为空显示空图表
if (list.length === 0) {
chartInstance.emptyOptions()
return
}
//处理数据
const xData = list.map((item) => item.date)
const value= list.map((item) => item.value)
//修改数据
test.xAxis[0].data = xData
test.series[0].data = value
chartInstance.setOptions(test)
}